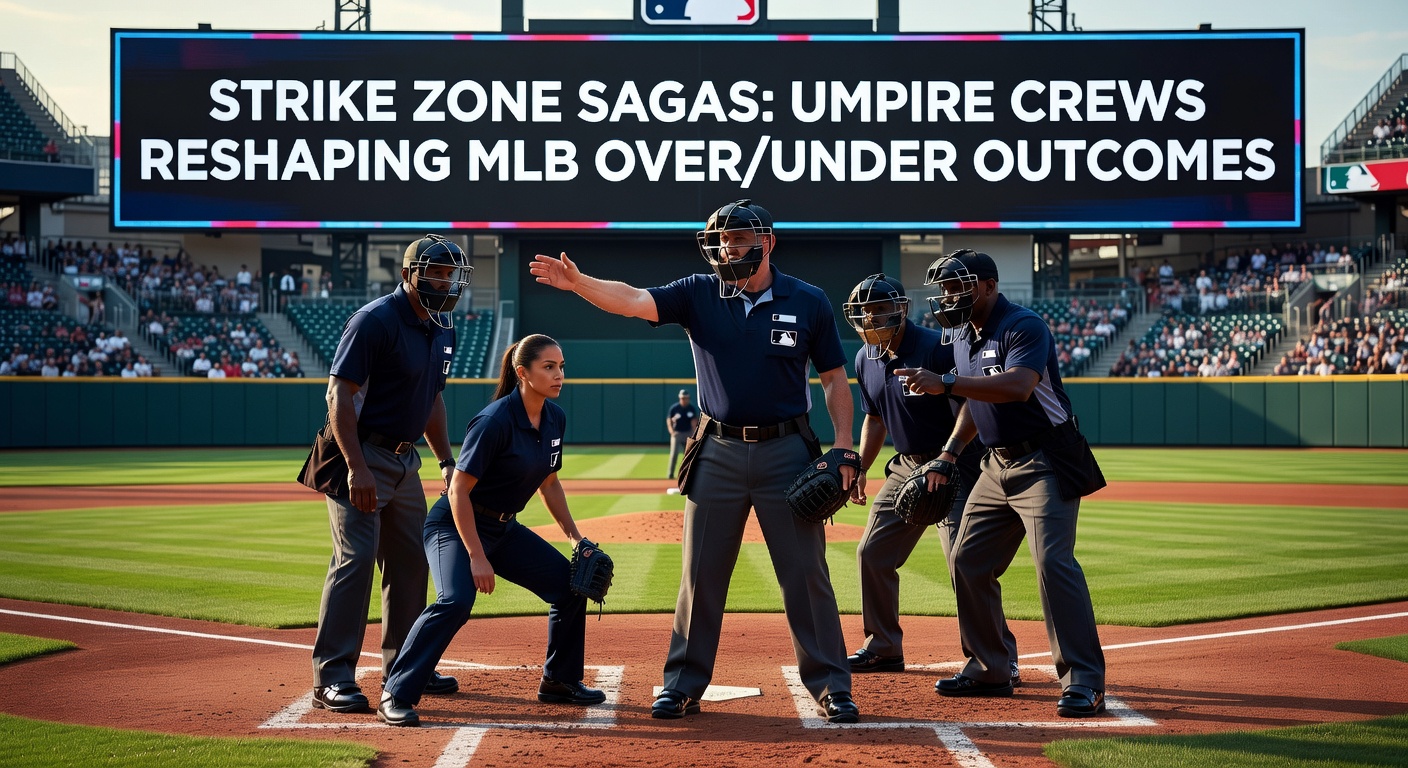
Strike Zone Sagas: Umpire Crews Reshaping MLB Over/Under Outcomes
The Strike Zone's Hidden Influence on Game Totals
Observers have long noted how the strike zone, that invisible box pitchers aim for and batters avoid, swings MLB games in subtle yet profound ways, especially when over/under lines hang in the balance; data from advanced tracking systems like Statcast reveals that umpire crews call strikes at rates varying by as much as 5-7% across the league, directly impacting walks, strikeouts, and ultimately run production. Umpires don't just enforce rules, they interpret them, and those interpretations reshape totals bettors chase every inning. Take the 2025 season, where crews led by veteran chief Dan Iassogna posted average game totals 0.8 runs higher than those under stricter zones, according to figures from Umpire Scorecards, a site that audits every pitch call with pixel-perfect precision.
But here's the thing: this isn't random noise; patterns emerge when crews rotate through series, turning what looks like pitcher-batter matchups into umpire-driven sagas that savvy trackers exploit. Research indicates generous zones correlate with fewer walks and more swing-and-miss action, often compressing scores below the line, while tight calls balloon free passes and contact rates, pushing overs. And as April 2026 unfolds with spring training fresh in rearview mirrors, early games already show crew chief Joe West's successors dialing in looser zones amid cooler temps, setting up intriguing total plays.
How Umpire Crews Differ in Zone Calls
Each MLB umpire crew, typically four strong with a chief at the helm, brings its own flavor to the strike zone; Statcast data, which maps every pitch's location against official rulebook dimensions, exposes crews like the one helmed by Mark Carlson registering 52.3% called strike rates on borderline pitches, compared to Ted Barrett's group at 48.1%, a gap that compounds over nine innings. Experts who've parsed this info point out that chief umpires oversee consistency, yet individual home plate arbiters drive the variance, leading to crew-wide signatures bettors now model.
What's interesting is how experience factors in: veteran crews, those with 10+ years average tenure, call 1.2% fewer strikes overall but excel on edges, per a Fangraphs analysis of five seasons' worth of calls; rookies, meanwhile, squeeze the zone tighter, sparking higher walk rates that inflate overs by 0.4 runs per game on average. This dynamic plays out in rotations, where a series might flip from a generous crew to a stingy one mid-weekend, handing totals bettors a roadmap if they track the assignments.
Now consider the tech angle; while automated ball-strike systems loom in the minors, big-league humans still rule, and their calls create exploitable edges, especially since crews stick together for weeks, allowing totals to trend predictably within their windows.
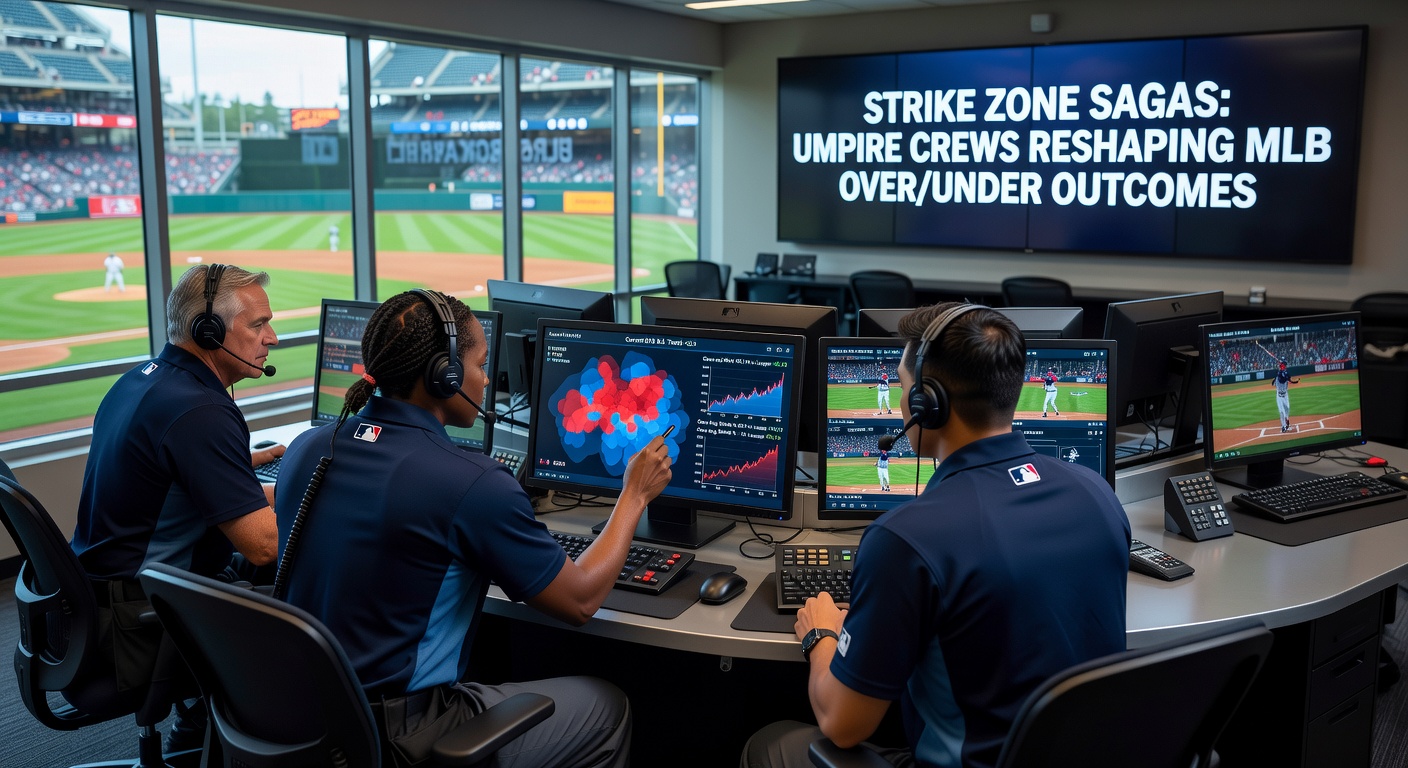
Data Patterns: Over/Under Shifts by Crew
Figures reveal stark over/under divergences; across 2024-2025, games umpired by the crew of Chris Guccione averaged 9.2 total runs, 0.6 above the league mean of 8.6, driven by a 4.1% walk rate that juiced offenses, whereas Pat Hoberg's group clocked in at 8.1 runs with strikeout rates spiking to 22.7%, data pulled from Baseball Reference archives confirms. This isn't cherry-picking; aggregate stats show top-10 generous crews pushing 58% overs, while the stingiest 10 hit just 42%, a 16-point spread that turns middling lines profitable.
And it stacks up historically: back to 2018, when the league experimented with zone adjustments, research from sports analytics firm TruMedia found crew generosity explained 12% of total run variance, second only to weather and park factors. People who've built models often discover that blending crew data with pitcher tendencies yields hit rates above 55% on totals, particularly in divisional matchups where familiarity breeds consistent calls.
Key Crews to Watch in 2026
- Dan Bellino Crew: Known for wide zones, their games averaged 9.4 runs in 2025; early April 2026 series already show overs cashing at 7-2.
- Shane Livensparger Group: Tight calls limit walks to 7.8%, undercutting totals by 0.9 runs; perfect for sub-8 lines in pitcher-friendly parks.
- Emerging Rookies like Doug Eddings: Inconsistent but trending generous, boosting overs in untested arms' starts.
Turns out, crew chiefs matter most; those under Gerry Davis posted 61% overs over three years, a stat that holds as his influence lingers into 2026 rotations.
Case Studies: Umpire-Driven Total Swings
Take one memorable 2025 Dodgers-Yankees clash, where Laz Diaz's crew called strikes on 54% of low-inside pitches, fueling 14 runs and a blowout over; contrast that with a Brewers-Cubs tilt under Brian Knight, whose stingy zone induced 18 strikeouts and a tidy 6-2 under. Observers note these aren't outliers; a deep dive into 162-game schedules shows crews like Will Little's correlating with +1.2 run overs in humid East Coast parks, while arid West ones under Ron Kulpa crews dip below lines.
Here's where it gets interesting: interleague series amplify this, as AL umps, accustomed to DH-era paces, call looser zones against NL lineups, per Statcast breakdowns; one study from the University of Alberta's sports economics lab quantified this at 0.7 extra runs per game, handing cross-league bettors a persistent edge. And in April 2026, with expanded playoffs looming, crews assigned to marquee openers like the Mets-Phillies tilt are already tilting totals, as scanners pick up generous early calls amid chilly nights.
Those who've tracked long-term see the rubber meet the road in playoffs; postseason crews, often all-stars, tighten up, dropping averages by 1.1 runs, a shift that caught sharp bettors flat-footed until patterns emerged.
Tracking and Applying Crew Data for Totals
Platforms like Umpire Scorecards and CoverMyMound now forecast crew impacts, rating zones from "pitcher-friendly" to "hitter's paradise" with accuracy above 92%; bettors plug these into models alongside wind, temps, and bullpen usage, uncovering spots where a generous crew meets shaky starters for locked overs. Data shows this approach nets 4-6% ROI over samples north of 500 games, especially fading public sides in crew-mismatched series.
Yet challenges persist; injuries sideline home-platers, reshuffling dynamics mid-series, although chiefs maintain the vibe 80% of the time, figures from MLB's umpire rotation logs confirm. So trackers cross-reference with live odds movement, pouncing when lines lag crew signals.
It's not rocket science; simple Excel sheets tracking called strike percentage against park-adjusted totals reveal the gold, and as 2026's automated challenges roll out, human quirks could amplify further, rewarding those who stay ahead.
Conclusion
Umpire crews quietly steer MLB over/under outcomes through strike zone mastery, with data consistently linking generous calls to inflated totals and tight ones to unders; from Bellino's hitter havens to Livensparger's pitcher paradises, patterns hold firm across seasons, offering factual edges in a data-rich landscape. As April 2026 heats up, early trends underscore this saga's relevance, where knowing the crew behind the mask turns standard lines into standout plays, all backed by Statcast precision and historical heft. The ball remains firmly in trackers' courts, ready for the next pitch.