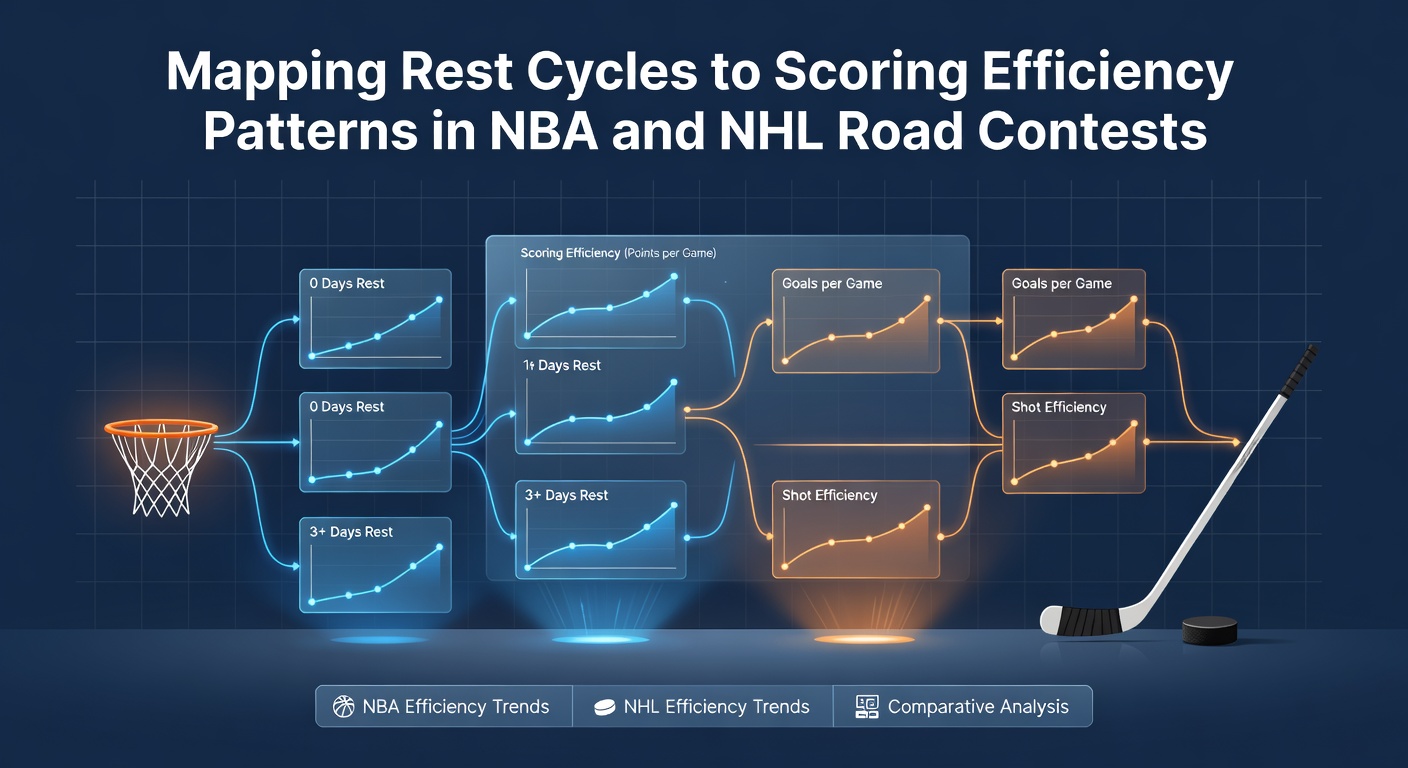
Mapping Rest Cycles to Scoring Efficiency Patterns in NBA and NHL Road Contests
Teams in the NBA and NHL frequently navigate demanding travel schedules that affect how players recover between games, and analysts track these rest cycles against scoring outputs during away contests to identify measurable patterns. Data from recent seasons shows that back-to-back road games often coincide with reduced field goal percentages in basketball while power play conversion rates shift in hockey depending on recovery windows.
Rest Cycle Fundamentals in League Schedules
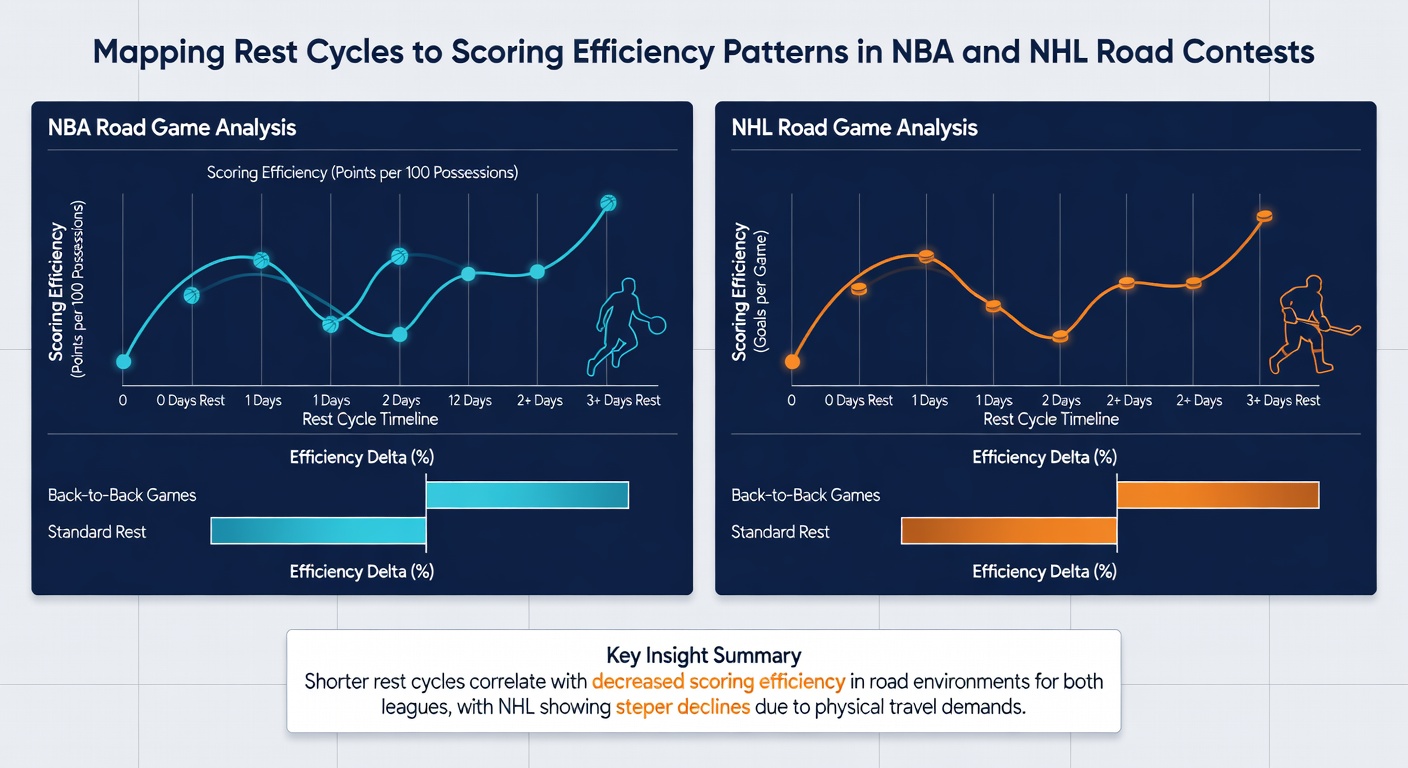
League calendars set the stage for rest variations because the NBA packs 82 games into roughly six months while the NHL spreads 82 contests across a similar span yet deals with different travel demands across North American cities. Observers note that road teams with fewer than 24 hours between games record lower points per possession in the NBA according to tracking systems maintained by league statisticians, and similar trends appear in NHL road contests where goals scored per 60 minutes drop when rest falls below a full day.
NBA Road Efficiency Trends
Researchers compiled box score information from the 2024-2025 campaign and found that teams playing their third game in five nights on the road posted three-point shooting percentages that averaged 2.8 points lower than squads with at least two full rest days. This pattern holds across multiple divisions because longer flights compound fatigue effects on perimeter shooting accuracy. Data indicates that interior scoring remains more stable yet transition offense efficiency declines noticeably when rest cycles shorten, which in turn alters how coaches adjust lineups mid-game.
NHL Road Contest Adjustments
Hockey presents distinct recovery dynamics since games involve higher physical contact and shorter shifts, and analysts have documented that road teams with minimal rest convert fewer high-danger chances into goals. Figures reveal that power-play units operating on back-to-back nights in May 2026 during the regular season finale stretch achieved success rates roughly 4.1 percent below season averages when travel exceeded 1,200 miles. Penalty kill units meanwhile maintain steadier performance because defensive zone coverage relies more on positioning than explosive speed, although goalie save percentages on the road dip slightly after consecutive nights of play.
Take one research group that examined 2025 playoff road performances and discovered that teams granted an extra recovery day before elimination games increased even-strength goal rates by measurable margins compared with squads arriving the same morning. These observations align with broader scheduling studies that connect circadian rhythm disruptions to on-ice decision-making speed.
Comparative Data Across Both Leagues
Cross-league comparisons highlight shared elements such as reduced offensive zone time when rest cycles compress yet reveal sport-specific differences because basketball relies on continuous running while hockey emphasizes repeated bursts. Statistics compiled through 2026 show NBA road squads averaging fewer assists per game after short rest whereas NHL road clubs record higher blocked shot totals as defensive focus sharpens under fatigue. Analysts integrate these metrics into models that predict scoring distributions rather than final margins alone.
Travel Distance and Recovery Overlap
Longer road trips across time zones introduce additional variables because west-to-east travel disrupts sleep patterns more than intra-division jaunts, and data from Canadian transportation studies on athlete mobility supports the link between extended flights and next-day reaction time reductions. NBA teams crossing multiple zones post lower effective field goal percentages in the first quarter while NHL clubs allow more shots on goal during early periods after such journeys.
What's interesting is how bench production changes because reserves who receive fewer minutes on short-rest nights still influence scoring efficiency through hustle plays and defensive rotations. Teams that rotate depth effectively mitigate some efficiency drops according to season-long tracking data.
Conclusion
Mapping rest cycles against road scoring efficiency provides concrete benchmarks that teams and analysts reference when reviewing performance logs from both leagues. Patterns observed through 2026 demonstrate consistent relationships between recovery windows and offensive output metrics across NBA and NHL away contests, offering a factual foundation for schedule evaluation and performance tracking.