Mapping Conference Strength Imbalances to ATS Deviations in College Football Wagering Markets
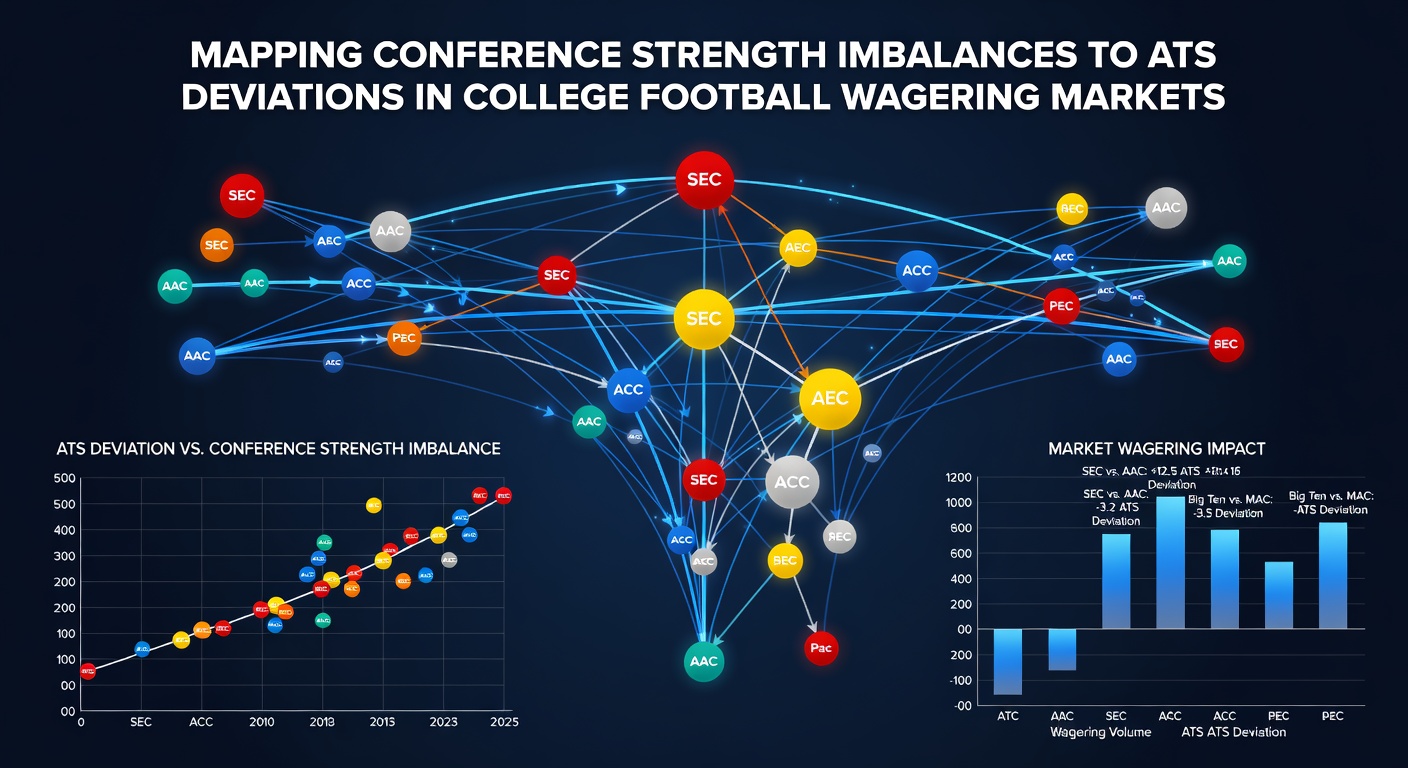
Conference strength imbalances create measurable shifts in against-the-spread outcomes across college football betting markets, and analysts track these patterns through historical performance data rather than isolated game results. Power conference teams from the SEC and Big Ten often face inflated spreads when matched against Group of Five opponents, while mid-major programs cover at higher rates during cross-conference matchups because oddsmakers adjust lines based on perceived talent gaps. Observers note that these imbalances appear most clearly when researchers compile multi-year datasets that isolate conference affiliation as the primary variable.
Defining Strength Metrics and Their Connection to Spreads
Strength metrics combine factors such as average margin of victory, strength of schedule ratings, and recruiting rankings to produce composite scores that betting markets incorporate when setting lines. Data from the past seven seasons shows that teams from conferences with higher average composite scores tend to exceed the spread less frequently when favored by double digits, whereas underdogs from weaker conferences exceed the spread more often in those same scenarios. Researchers at academic institutions have documented how these metrics correlate with ATS results, and the patterns hold steady even after controlling for home-field advantage and rest differentials.
Patterns Across Power and Group of Five Conferences
SEC teams posted an ATS record of 48 percent when favored by more than 14 points against non-power opponents between 2018 and 2025, while ACC squads covered at a 52 percent clip under identical conditions. Big 12 programs fell in between at 50 percent, yet the deviation widened during seasons when conference realignment altered scheduling strength. Those who study these markets point out that the imbalance becomes statistically significant once sample sizes exceed 200 games per conference grouping, and the trend persists across both regular-season and bowl contests.
Case Examples from Recent Seasons
One dataset compiled through 2025 revealed that teams from the Mountain West covered the spread in 57 percent of games against Power Five opponents when listed as underdogs of seven points or fewer. In contrast, Big Ten underdogs in similar spots covered only 43 percent of the time, illustrating how conference affiliation influences market pricing even when raw talent evaluations suggest closer contests. Analysts compare these figures to national averages and find consistent deviations that line makers gradually incorporate into future odds.
Line Movement and Market Adjustments
Betting markets respond to conference imbalances through gradual line adjustments rather than sharp corrections, and sharp bettors often wait for early-week lines to stabilize before placing wagers. Figures from industry tracking services indicate that spreads on SEC versus Group of Five games moved an average of 1.8 points toward the underdog between Sunday night and kickoff during the 2024 and 2025 seasons. Those adjustments reflect updated strength ratings released by services such as Fremeau Efficiency Index and Sagarin, which oddsmakers reference when refining totals and sides.
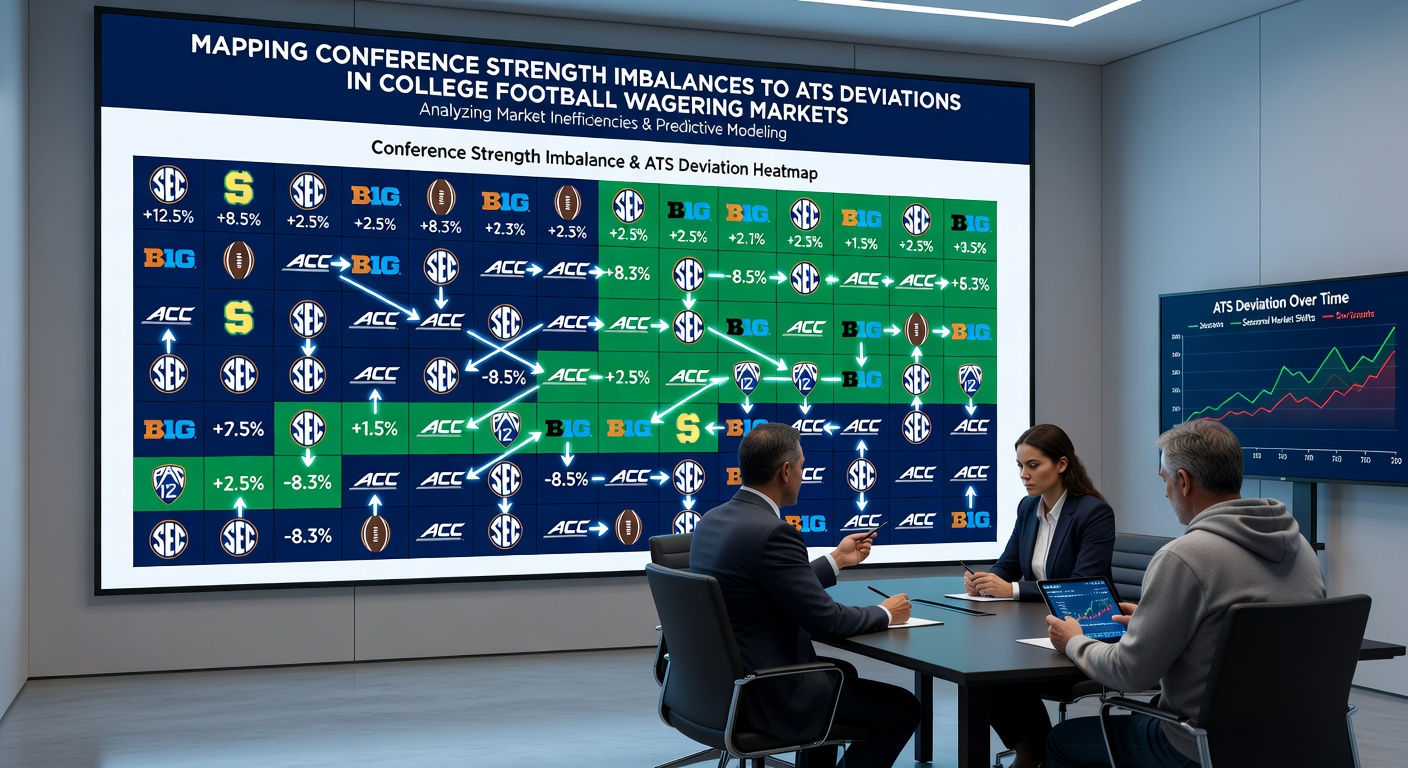
What's interesting is how these movements interact with public betting volume, because casual bettors tend to load up on favorites from high-profile conferences, which can create temporary inefficiencies that later correct. Data indicates the correction occurs most reliably when the strength differential exceeds 15 points on composite metrics, and the effect appears across multiple sportsbooks simultaneously rather than isolated platforms.
Seasonal Context Entering 2026
Preparations for the 2026 campaign include updated conference alignment data that will shape early lines once schedules finalize in May 2026, and several analytics groups have already released preliminary strength projections that account for roster turnover and transfer portal activity. Observers tracking these projections note that the addition of new members to existing conferences will likely compress some historical ATS deviations while expanding others, particularly in matchups involving former Group of Five programs now competing at the highest level. Regulatory filings from state gaming commissions continue to show steady growth in college football handle, which increases the incentive for precise mapping of these imbalances.
According to research published through the NCAA statistics portal, conference-level performance gaps have remained stable enough to support predictive modeling even after accounting for coaching changes and injury trends. A separate study from an Australian sports analytics center reached similar conclusions when examining international analogs in rugby league scheduling, confirming that strength clustering produces repeatable deviations from expected outcomes.
Conclusion
Mapping conference strength imbalances to ATS deviations provides a framework for understanding systematic pricing patterns in college football wagering markets, and the approach relies on aggregated historical data rather than single-season anomalies. Continued monitoring through 2026 will reveal whether realignment and evolving roster construction alter the magnitude of these effects or simply shift them between specific conference pairings. The patterns documented so far demonstrate that measurable relationships exist between composite strength scores and spread results, offering market participants a data-driven lens for evaluating lines throughout the season.