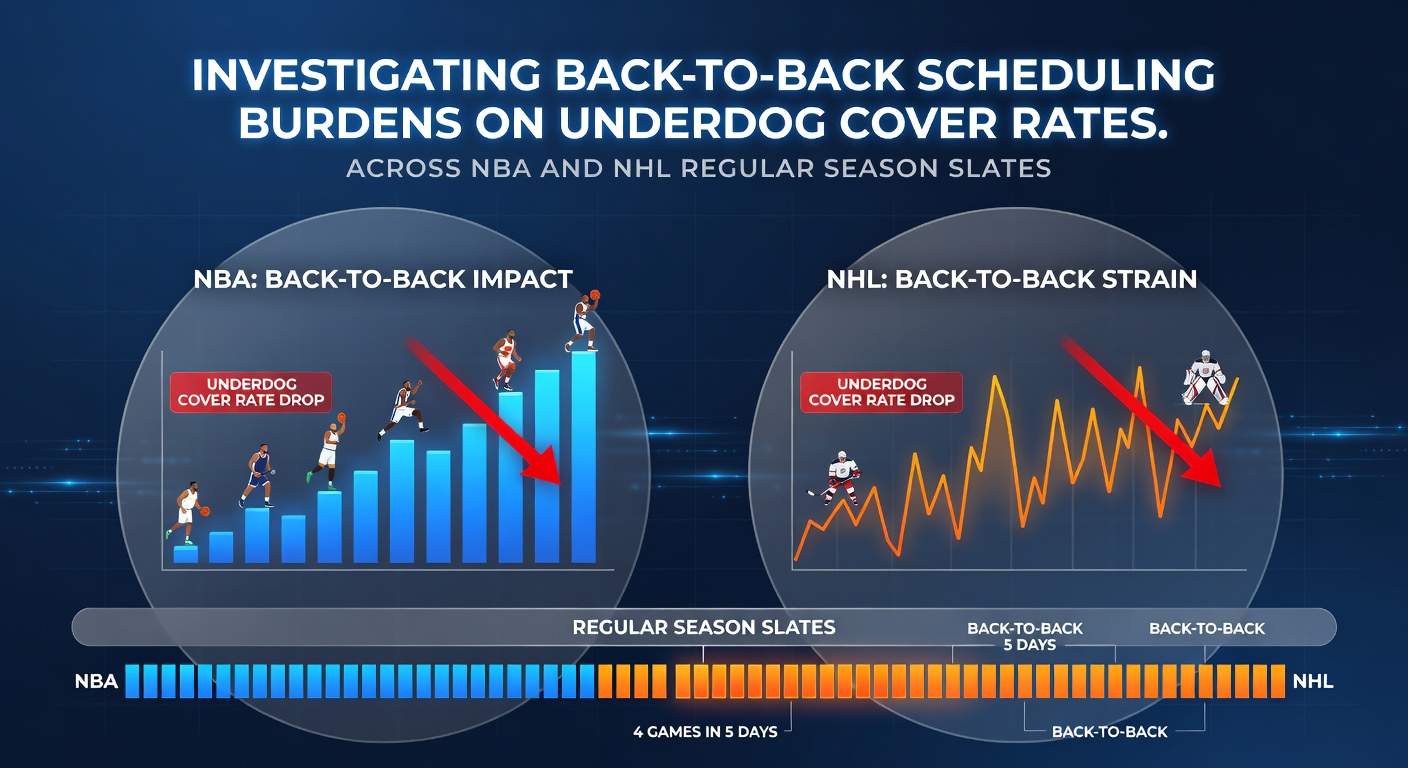
Investigating Back-to-Back Scheduling Burdens on Underdog Cover Rates Across NBA and NHL Regular Season Slates
Back-to-back games create measurable scheduling pressures that reshape team outputs in both the NBA and NHL, and analysts track these patterns through regular season data sets collected over multiple campaigns. Teams often log significant travel miles between venues on consecutive nights, which correlates with shifts in scoring efficiency and defensive metrics that influence how underdogs perform against the spread.
Scheduling Patterns and Travel Demands
NBA franchises encounter back-to-back sets roughly 15 to 20 times per season depending on conference alignment, while NHL clubs face similar clusters amid a compressed 82-game calendar that stretches from October through April. Observers note that West Coast teams absorb higher cumulative fatigue when they cross time zones for these matchups, and data compiled by league operations departments shows elevated rest differentials between opponents in these slots.
Researchers at major sports analytics programs have compiled travel logs that link these sequences to modest declines in shooting percentages and shot volume for the second game of a pair, yet the effects appear more pronounced in the NHL where physical contact accumulates across shorter recovery windows.
Underdog Cover Rates in the NBA
Historical betting data from regular season slates reveals that underdogs in back-to-back situations cover the spread at rates that vary by rest advantage and venue. When the underdog arrives on a back-to-back while the favorite enjoys at least one day off, cover percentages for the underdog climb into the low 50s across large sample sizes drawn from the past five seasons.
League tracking systems record these outcomes through play-by-play archives that highlight reduced transition efficiency and lower three-point conversion for fatigued squads, and such adjustments alter closing totals in ways that favor the side receiving points. Analysts compare these figures against baseline cover rates for teams with equal rest, where the gap narrows considerably.
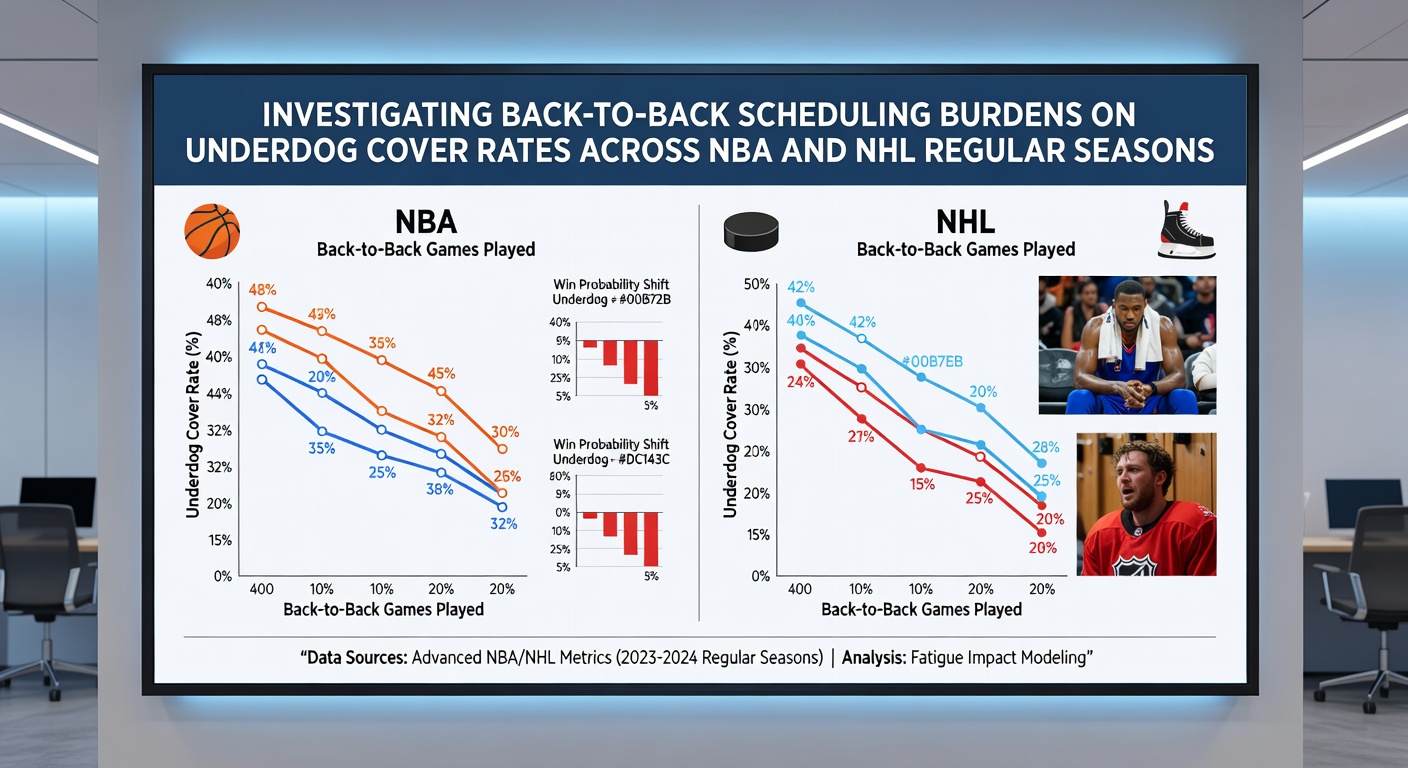
Comparative Trends in the NHL
NHL schedules distribute back-to-backs across divisions with notable frequency, and goalie performance logs indicate that netminders on short rest post lower save percentages in the second contest of a set. Underdogs facing such conditions have covered at elevated rates in Pacific and Central divisions according to aggregated season results, while Eastern Conference data shows tighter distributions tied to fewer cross-country trips.
Studies from Canadian research institutions document how ice quality and physical wear compound these effects, producing shifts in shot attempts and blocked shots that betting markets incorporate into opening lines. Figures from the 2025-2026 regular season, examined in early May 2026, confirm consistent patterns where underdog covers rise when both clubs share back-to-back burdens but one holds home ice.
Key Variables and Seasonal Context
Multiple factors interact with scheduling burdens, including injury reports released 90 minutes before tipoff and divisional rivalry intensity that can override rest disadvantages. Data sets distinguish between intra-conference and inter-conference back-to-backs, revealing that the latter produce wider variance in final margins and therefore higher underdog cover frequency in both leagues.
League offices release annual schedule fairness reports that quantify these distributions, and independent tracking services cross-reference them against public betting records to isolate rest-related edges. What's interesting is how these patterns hold across home and away designations, though home underdogs on back-to-backs demonstrate slightly stronger results in NHL samples than in NBA equivalents.
Conclusion
Comprehensive examination of regular season outcomes demonstrates that back-to-back scheduling burdens produce identifiable effects on underdog cover rates in the NBA and NHL, with rest differentials serving as the primary driver across seasons. Observers continue to monitor these metrics through updated league data releases, and the trends observed through May 2026 provide a foundation for further seasonal comparisons.