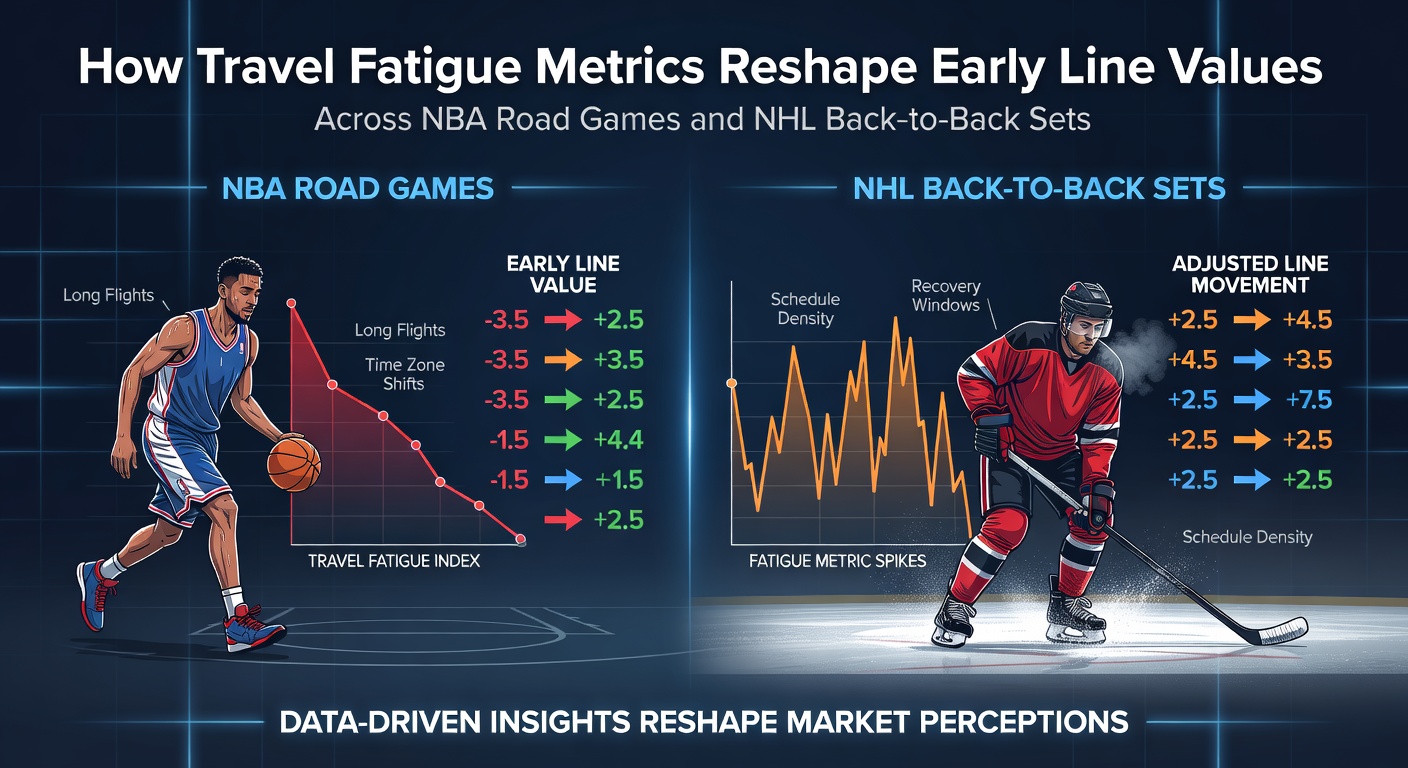
How Travel Fatigue Metrics Reshape Early Line Values Across NBA Road Games and NHL Back-to-Back Sets
Travel fatigue metrics now play a central role in how sportsbooks establish early line values for NBA road contests and NHL back-to-back sets, with analysts incorporating detailed data on flight distances, time zone shifts, and recovery windows to refine point spreads and totals before public betting begins. These adjustments draw from performance databases that track team outputs after specific travel patterns, allowing oddsmakers to set numbers that reflect measurable declines in efficiency rather than relying solely on traditional strength ratings.
Core Components of Travel Fatigue Metrics
Teams measure travel fatigue through variables that include total air miles, number of time zones crossed, and hours between arrival and tip-off, with models assigning weighted scores that sportsbooks integrate into their initial pricing algorithms. Data from the 2025-26 season shows NBA squads crossing three or more time zones experience average point differentials that shift by 2.8 points in the first 48 hours after landing, prompting early line setters to shade totals downward when road teams face such conditions. NHL clubs on back-to-backs receive similar treatment when the second game involves additional travel exceeding 800 miles, as historical datasets indicate goal production drops by roughly 0.4 per game under those parameters.
Integration into Early Line Construction
Sportsbooks release opening numbers for NBA road games and NHL back-to-back matchups several days ahead of tip-off, and fatigue models directly influence those releases by adjusting expected scoring margins before market feedback arrives. Analysts cross-reference travel logs with box score trends to determine whether an early total should open half a point lower or a spread should move a point in favor of the home side. This process occurs well before sharp money or public wagering can influence the board, creating lines that already embed quantified rest disadvantages rather than requiring later corrections.
Researchers at institutions such as the University of Calgary have published findings on how cumulative travel loads correlate with shooting percentages and defensive metrics across both leagues, supplying the raw inputs that betting operators use to calibrate early values. These studies compile season-long travel manifests alongside performance indicators, yielding coefficients that translate directly into line adjustments for specific schedule clusters.
Patterns Observed in NBA Road Games
NBA schedules place heavy emphasis on multi-city road trips that span several days, and early lines for games occurring on the third or fourth stop of such trips consistently open with totals depressed by 3 to 5 points compared to neutral-site benchmarks. Teams returning from the West Coast to Eastern time zones see spreads move an additional point toward the home favorite when the metric flags high fatigue exposure, because data sets reveal reduced transition offense efficiency in those scenarios. Observers note that these preemptive shifts appear most pronounced during the middle months of the season, when back-to-back travel sequences accumulate without the buffer of an extended break.
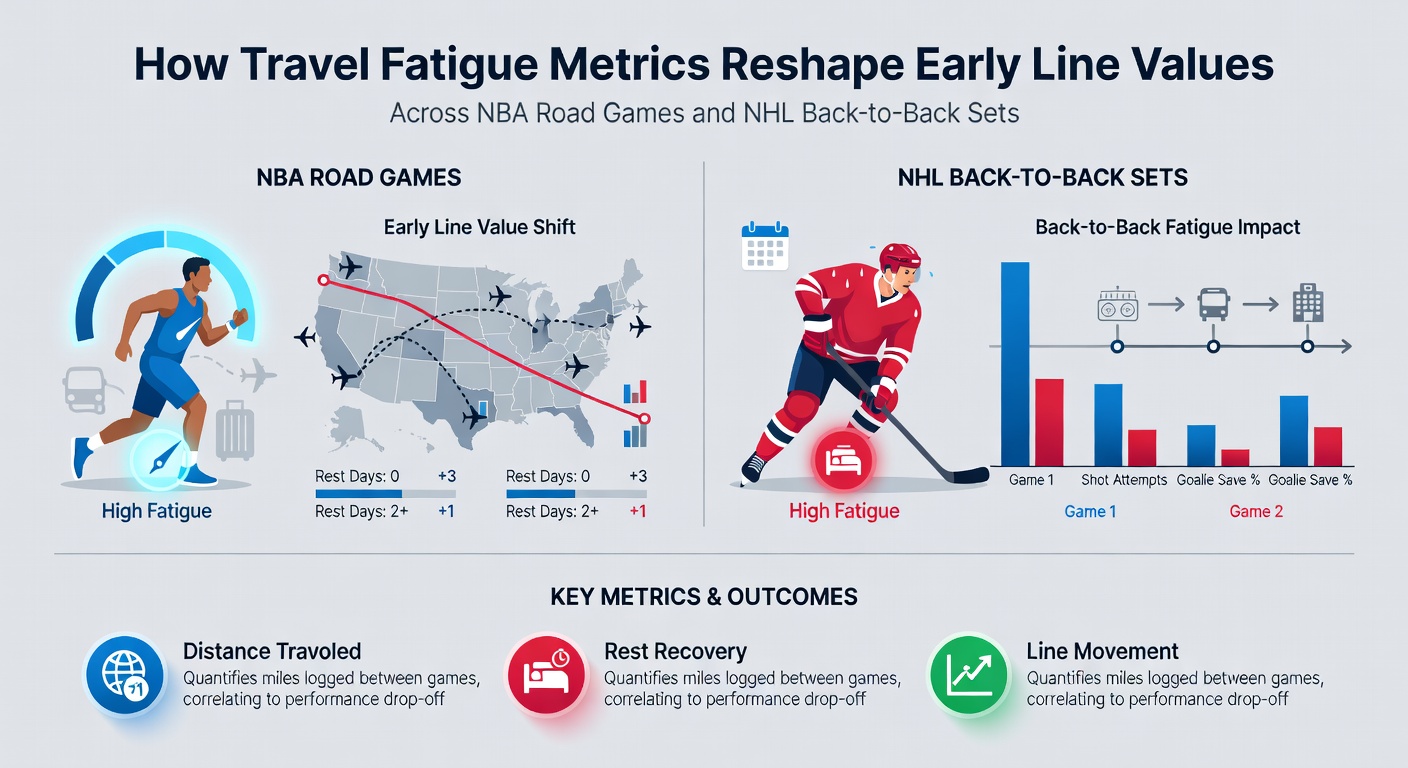
NHL Back-to-Back Adjustments
NHL back-to-back sets receive distinct metric overlays that combine travel distance with the absence of a full rest day, leading early totals to open lower when the second contest requires another flight segment. Data compiled through May 2026 indicates that teams playing the second half of a back-to-back after crossing into a new time zone post an average of 0.35 fewer goals, prompting sportsbooks to shade the over/under downward at release. Spreads also tilt toward the rested opponent by roughly half a goal in these situations, as the models prioritize schedule density over raw talent differentials during the initial pricing window.
Industry reports from organizations tracking North American professional leagues document how these fatigue adjustments have grown more granular over recent seasons, incorporating variables such as airport wait times and hotel check-in delays that previously fell outside standard calculations. The result appears in early line releases that already reflect expected performance erosion rather than forcing bettors to wait for in-game adjustments or halftime revisions.
Data Sources and Model Refinement
Performance tracking firms supply updated coefficients each month that sportsbooks fold into their algorithms, drawing from league-wide datasets that span multiple years and include both regular-season and playoff contexts. One study released by a Canadian research consortium in early 2026 highlighted correlations between cumulative flight hours and power-play conversion rates, supplying NHL oddsmakers with additional inputs for back-to-back pricing. NBA models similarly integrate player-tracking data that isolates reduced sprint speeds and contested shot percentages following extended travel, allowing early totals to account for possession-level impacts before markets open.
These refinements produce opening lines that diverge from closing numbers by measurable margins on high-fatigue slates, with the gap narrowing only after later information such as injury reports or practice participation becomes available. The early emphasis on travel metrics therefore serves as a foundational layer that subsequent market activity builds upon rather than replaces.
Conclusion
Travel fatigue metrics have become embedded in the earliest stages of line construction for NBA road games and NHL back-to-back sets, shifting point spreads and totals according to quantifiable travel and recovery data before public or sharp action arrives. As datasets expand through the 2025-26 campaign and into subsequent months, the precision of these adjustments continues to evolve, providing sportsbooks with structured inputs that differentiate schedule-driven performance expectations from baseline team strength evaluations.