Contract Year Effects on Prop Betting Markets in Professional Football and Basketball
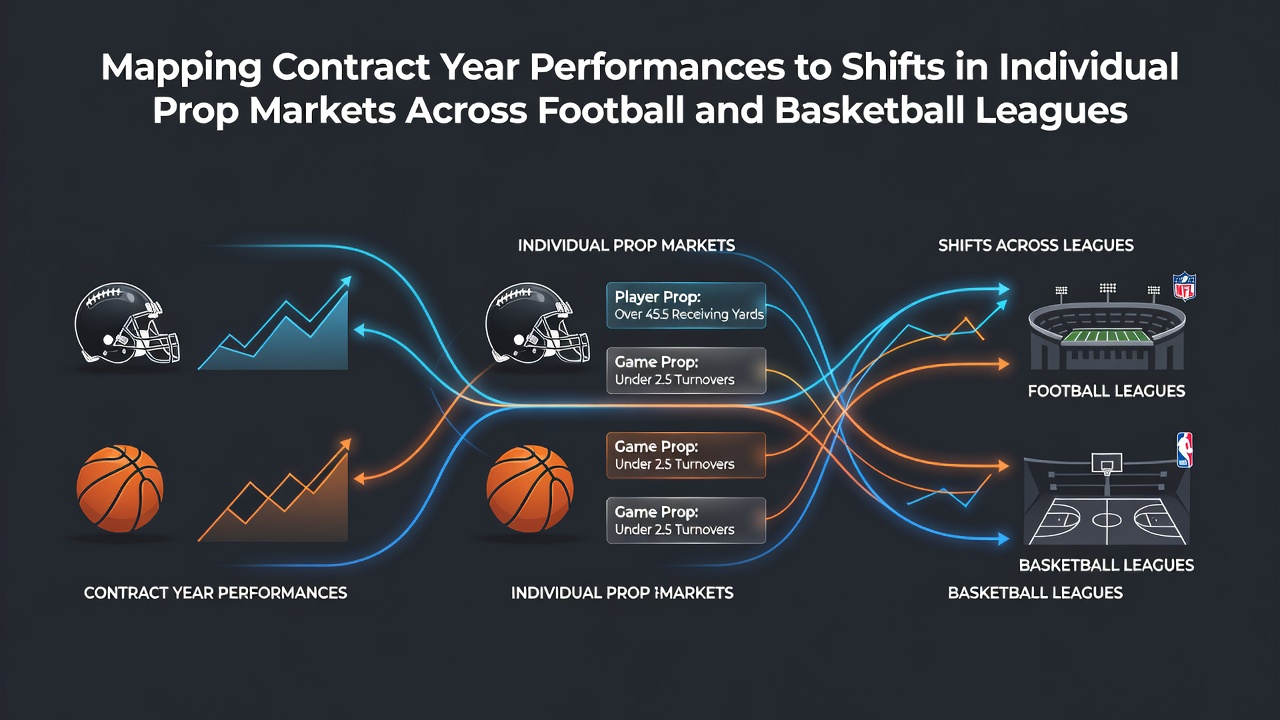
Contract year performances create measurable patterns in individual player prop markets across the NFL and NBA, with historical data sets revealing consistent shifts in line movements and betting volume. League records from the past decade show that players entering the final season of their contracts often post elevated statistical outputs in key categories such as passing yards, rushing attempts, points scored, and rebounds, and these changes prompt sportsbooks to recalibrate over/under thresholds accordingly.
Analysts tracking these trends note that average increases in production range from 8 to 15 percent in targeted metrics during contract years, based on aggregated player data released by the respective leagues. Such adjustments appear most pronounced in skill positions and perimeter roles, where individual contributions translate directly into prop categories, while team-oriented statistics like assists and tackles demonstrate smaller but still detectable variances.
Historical Data Patterns in the NFL
Football prop markets respond to contract year signals through early line adjustments in training camp and preseason windows, with oddsmakers incorporating performance histories from similar situations in prior seasons. Figures from the 2024 and 2025 campaigns indicate that running backs and wide receivers in their final contract years saw rushing and receiving yard props opened 4 to 7 yards higher on average compared to the previous season, reflecting both statistical upticks and increased public betting interest.
Quarterback props follow comparable trajectories, with passing touchdown lines shifting upward in several documented cases where players negotiated new deals shortly after strong contract-year outputs. External market data from the Pennsylvania Gaming Control Board confirms elevated handle on these specific player props during the regular season slate, particularly in weeks 8 through 14 when contract negotiations often intensify.
NBA Player Prop Adjustments and Contract Timelines
Basketball prop markets exhibit parallel movements, although the longer regular season schedule allows for more granular tracking of efficiency changes. Scoring averages for players in contract years rise by roughly 2.1 points per game according to league-tracked metrics, with corresponding lifts in three-point attempts and free-throw volume that directly influence over/under lines. Rebound and assist props also register measurable adjustments once midseason trade rumors or extension talks surface in media reports.
These shifts become visible in opening totals released by sportsbooks in late October and early November, with further tweaks occurring after the first 20 games when updated player usage rates become available. Observers note that frontcourt players show stronger correlations between contract status and rebounding prop movements than guards do with assist lines, a distinction that appears consistently across multiple seasons.
Market Response Mechanisms and Volume Shifts
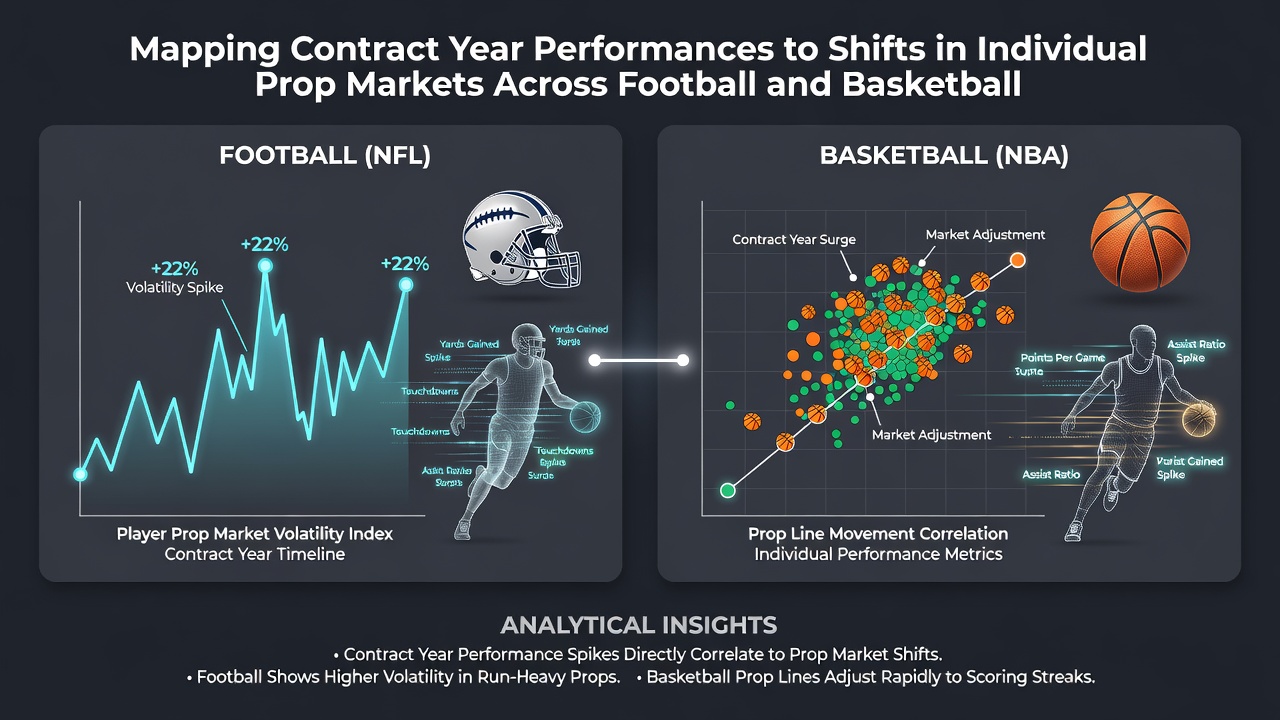
Sportsbooks integrate contract year indicators into their proprietary models alongside traditional factors such as opponent defensive rankings and recent form. This integration results in earlier and more pronounced line movements for high-profile names, while lesser-known players experience subtler adjustments that still reflect the same underlying performance trends. Betting volume on these props increases noticeably in the weeks following contract extension announcements, as sharp bettors test whether the elevated production will continue into the next season.
Research from academic institutions including Carnegie Mellon University's sports analytics program has documented these volume patterns through anonymized transaction data shared by partner operators. The studies highlight that sharp action tends to cluster on overs during the first half of the contract year, with under bets gaining traction later once defensive schemes adapt and minutes or snaps are managed more conservatively.
League-Specific Variables and Scheduling Context
NFL scheduling creates compressed windows for observing contract year effects, with bye weeks and weather variables adding layers to prop calculations. Basketball's 82-game structure provides longer sample sizes, yet load management practices introduce additional variability that oddsmakers must weigh against contract incentives. Both leagues publish usage rate and snap count data that allow for cross-referencing with prop market histories, and these datasets reveal that players on expiring deals receive elevated opportunities in high-leverage situations compared to those under long-term contracts.
August 2026 preparations for the upcoming seasons already include preliminary contract year monitoring by analytics teams, with early projections factoring in free-agent classes and upcoming cap situations. These projections feed into initial prop line frameworks released during training camp periods, establishing baselines that evolve as regular season games accumulate.
Conclusion
Contract year performances generate predictable, data-backed shifts in individual prop markets across football and basketball, with league statistics and betting handle records demonstrating consistent directional movements in player-specific lines. Ongoing tracking of these patterns continues to inform how markets open and adjust throughout each season.