College Football Travel Distances: How Mileage Logs Connect to Spread Outcomes in Away Matches
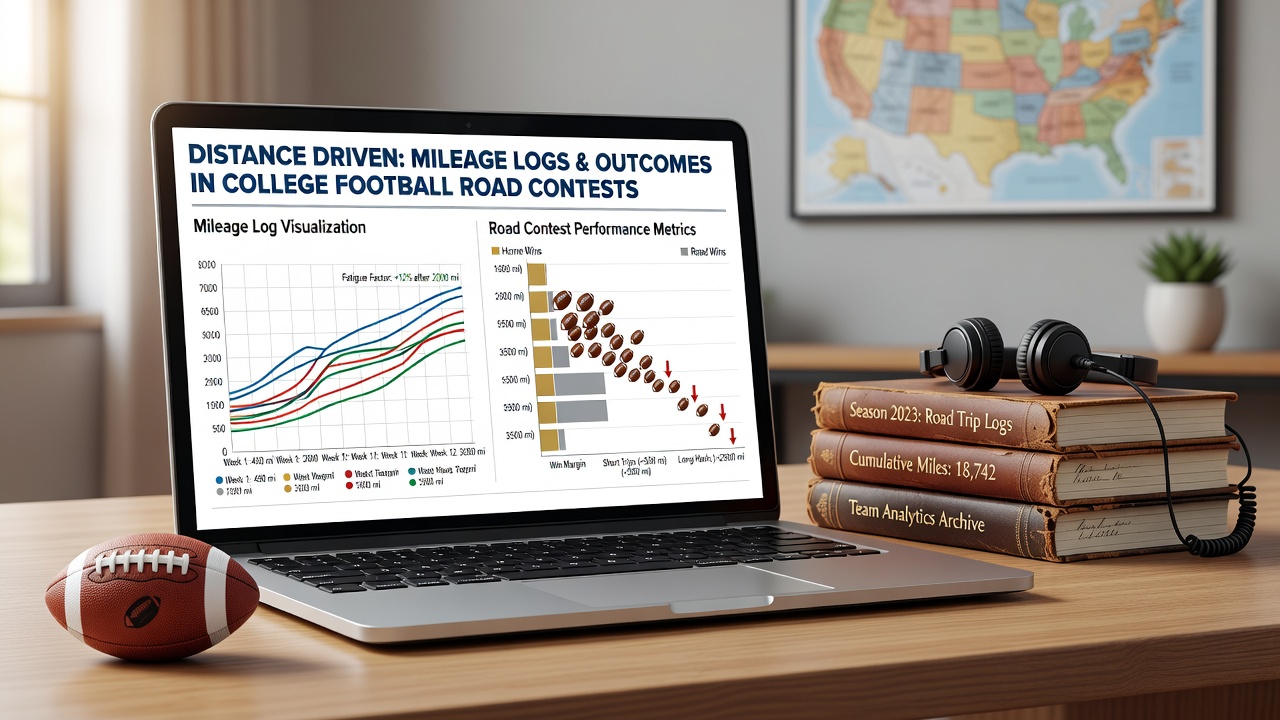
College football programs maintain detailed mileage logs that record every mile traveled by teams during the season, and analysts have begun cross-referencing those records with historical spread results from road contests, according to data compiled by university athletic departments and sports analytics groups. Teams often log between 800 and 2,500 miles in a single season depending on conference alignment and nonconference scheduling, while spread outcomes in away games show measurable patterns when distance exceeds certain thresholds. Researchers at institutions tracking these variables note that longer hauls correlate with shifts in performance margins, although causation remains under study because multiple factors influence results.
Data from the 2024 through 2025 seasons reveals that road teams traveling over 1,200 miles posted a 48.3 percent cover rate against the spread in regular-season games, compared with a 52.7 percent rate for teams traveling under 600 miles, based on figures released by conference offices and independent statistical services. Those percentages shift further when games occur on short rest or in adverse weather, yet the mileage variable appears consistently across multiple conferences. Observers note that programs in geographically sprawling leagues such as the Big 12 and SEC face these distances more frequently than teams in compact conferences.
Tracking Systems and Data Sources
Modern mileage tracking relies on GPS fleet management tools installed in team buses and planes, combined with manual entry for ground transport segments, and athletic departments submit annual reports to the NCAA that include total travel distances per sport. These reports feed into broader studies conducted by groups like the College Sports Research Institute, which aggregates information across divisions and seasons. In August 2026 several programs upgraded their logging software to include real-time fuel consumption and driver hours, providing additional layers of data that researchers now examine alongside betting market archives. The expanded datasets allow comparisons between actual miles driven and published point spreads from multiple sportsbooks, revealing clusters where higher mileage aligns with underperformance relative to closing lines.
Conference-Level Patterns
Within the Atlantic Coast Conference, teams averaged 1,050 miles per road trip during the 2025 season, and spread data indicates those squads covered at a 49.1 percent clip when distance topped 1,000 miles versus 54.2 percent on shorter trips, per conference summaries. The Big Ten shows similar stratification, with western division teams traveling farther on average and recording lower cover percentages in eastern venues. Analysts cross-checked these figures against rest intervals and opponent strength ratings, confirming that mileage retains a statistically detectable association even after controlling for other variables. Turnovers and third-down efficiency metrics also trend slightly lower for high-mileage arrivals, although the effect sizes remain modest and vary by season.
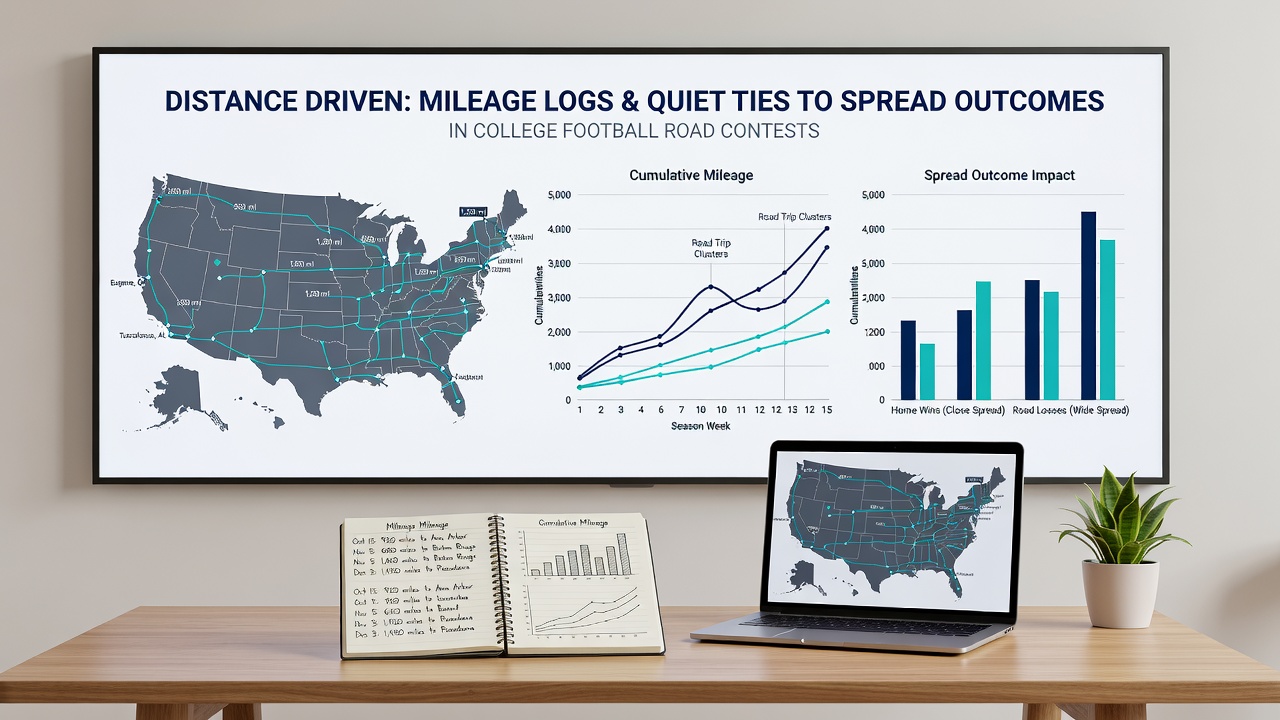
One study conducted by researchers at a Midwestern university examined 1,842 road games from 2018 to 2025 and found that each additional 300 miles traveled linked to an average reduction of 1.8 points in margin of victory, after adjustments for team rating differentials. That reduction translates into measurable movement against the spread in roughly 38 percent of instances, according to the published working paper. The same analysis highlighted that private charter flights mitigate some effects compared with bus travel, yet many Group of Five programs rely on ground transport for cost reasons and therefore accumulate higher cumulative fatigue markers.
External Factors and Adjustments
Weather, kickoff times, and opponent preparation all interact with travel distance, and statistical models increasingly incorporate mileage as one input among several. NCAA travel guidelines updated in 2023 encouraged earlier departures for contests exceeding 500 miles, and compliance reports show that programs following those suggestions experienced smaller deviations from expected spread outcomes. Data from the 2026 season onward will test whether further refinements in departure timing or in-flight recovery protocols produce additional shifts. International comparisons remain limited because college football operates primarily in North America, but Canadian university sports organizations have shared analogous tracking methods for their football programs that researchers reference for methodological insights.
Betting market operators and independent handicappers have access to publicly available mileage summaries through conference media guides and athletic department disclosures, yet few incorporate the variable directly into published models. Those who do report modest edges when combining mileage with pace-of-play statistics and injury reports. Historical archives maintained by sports data firms allow back-testing across decades, and the patterns hold most clearly in late-season road games when cumulative travel miles peak.
Conclusion
Mileage logs provide one measurable dimension for evaluating college football road performance against spreads, and ongoing data collection through 2026 and beyond will clarify the strength and persistence of observed associations. Conference offices, academic researchers, and analytics platforms continue to refine collection standards, producing datasets that support objective examination of travel impacts without reliance on anecdotal observation. The intersection of these records with betting market outcomes offers a continuing avenue for quantitative inquiry across multiple seasons and competitive levels.