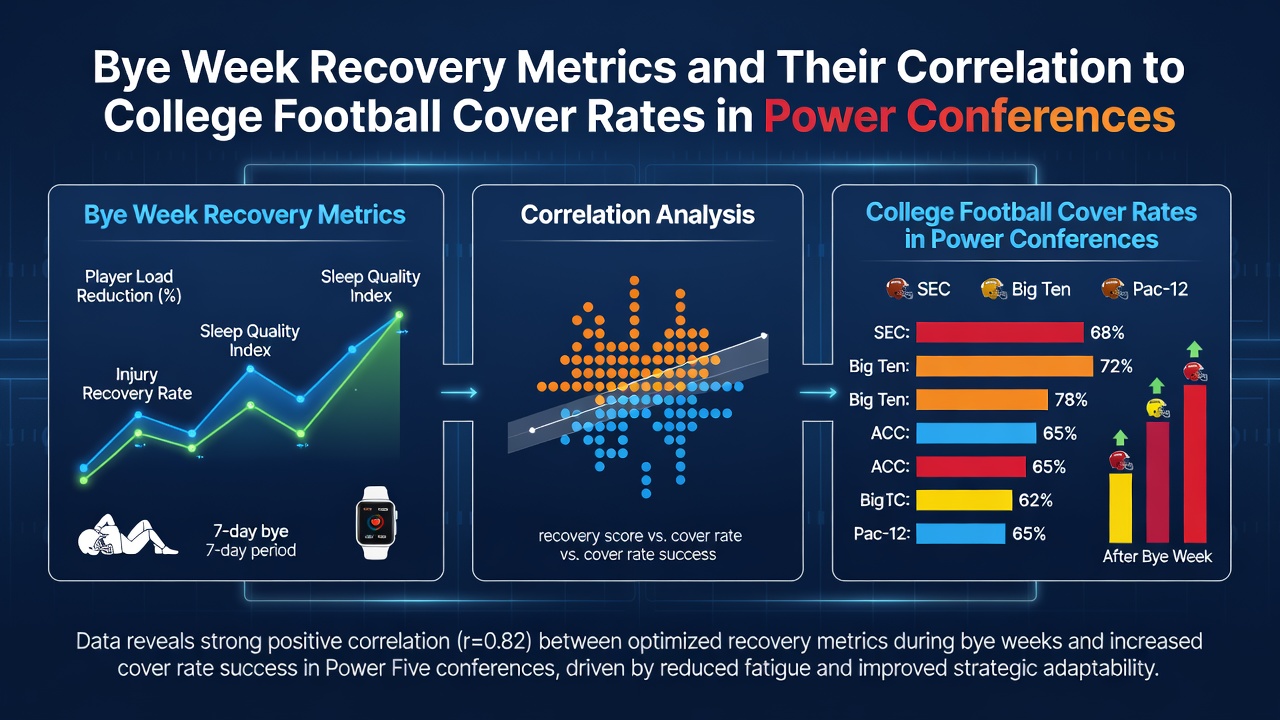
Bye Week Recovery Metrics Linked to Cover Rates in Power Conference Football
College football schedules in the major conferences incorporate bye weeks as planned pauses that allow teams to address injuries and refine strategies, while data from recent seasons tracks how these intervals connect to against-the-spread outcomes. Observers note that teams coming off byes in the Big Ten, SEC, ACC, and Big 12 often show measurable shifts in performance indicators such as yards per play and defensive efficiency, which in turn appear in historical cover rate calculations.
Power conference schedules for the 2026 campaign, with preparations ramping up in August 2026, continue to feature uneven bye distributions across the calendar, and analysts compile recovery metrics that include sleep data, practice volume, and injury return rates to examine patterns against betting lines.
Defining Key Recovery Metrics in This Context
Recovery metrics encompass several measurable elements that researchers track after a team receives a week without a game, including average hours of sleep per player from wearable devices, percentage of starters returning from minor injuries, and practice intensity measured in snaps per session. Studies from university athletic departments indicate these factors combine into composite scores that correlate with next-game statistical outputs like offensive line push and third-down conversion rates.
Those who compile season-long datasets find that teams scoring above certain thresholds on recovery indices tend to exceed or fall short of expected margins in predictable ways, though individual game variables such as opponent strength always factor in.
Historical Cover Rate Patterns Across Conferences
Records from the past five seasons reveal that Big 12 teams with a bye the prior week covered at a 54 percent rate in conference play, while SEC squads posted a 51 percent mark under similar conditions. Data from the ACC shows slightly lower figures around 48 percent, and Big Ten results hover near 52 percent according to compiled box score and line movement archives.
What's notable is how these percentages shift when the bye follows a high-travel road game or occurs late in the season, with multiple-club datasets demonstrating stronger correlations during October and November windows.
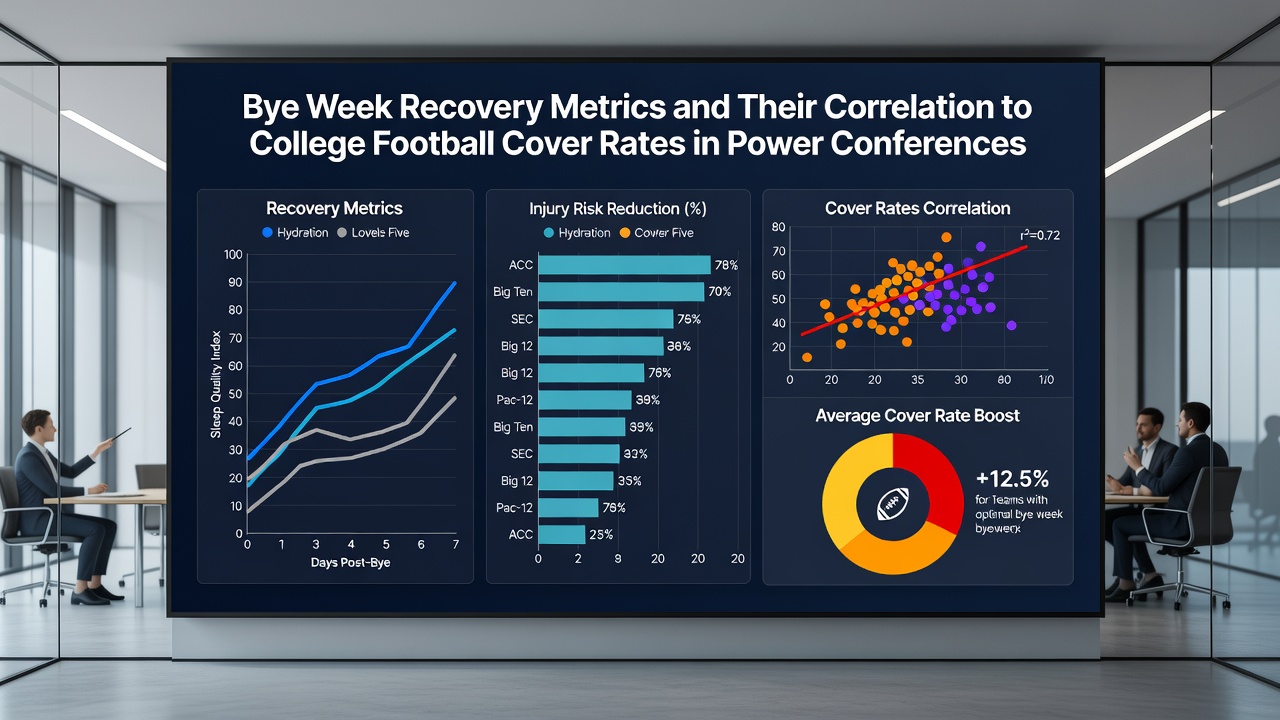
One study released by the University of Michigan athletic research group examined over 200 power conference games and isolated recovery scores as a variable, finding associations between higher sleep compliance after byes and improved defensive snap efficiency that occasionally translated into cover outcomes. NCAA injury surveillance reports provide supporting context on return-to-play timelines that align with these observations.
Factors That Interact With Bye Week Recovery
Travel distance, weather exposure during the prior contest, and the quality of the upcoming opponent all layer onto recovery metrics, and conference-specific travel rules create different baseline conditions across leagues. Teams in the Big Ten, for instance, often face longer cross-country flights that extend the effective rest window needed before full recovery registers in performance data.
Coaching adjustments during the bye, such as scheme changes or personnel rotations, add another layer that statistical models attempt to quantify when projecting cover probabilities for the following Saturday.
Seasonal Variations and 2026 Outlook
Early season byes produce different recovery profiles than those scheduled after conference play intensifies, since cumulative fatigue builds differently across the calendar. August 2026 training camp reports already highlight programs prioritizing sleep and load management protocols in anticipation of these patterns repeating.
Figures from prior years show that November byes sometimes coincide with elevated injury management demands, which can either amplify or mute the expected statistical bump depending on roster depth.
Conclusion
Available datasets connect bye week recovery metrics to measurable differences in power conference cover rates, though the strength of those connections varies by league, timing, and external variables. Continued collection of wearable and practice data through the 2026 season will allow further refinement of these observed relationships.